
.png?width=49&height=23&name=HIMA%20Logo_mini%20(1).png)

Though you may not be aware of it, Functional Safety is all around us, every day and just about everywhere we go. In technical terms, we can define Functional Safety as protecting people, the environment, and equipment from design and implemented systems. In more simple terms Functional Safety seeks to reduce risks, injury, and damage that could be caused by hardware, software, and systems by implementing protective functions.
Think about the coffee maker you use every morning. A protection function monitors the temperature of the coffee and the volume of coffee in the pot. When either exceeds acceptable levels, a sensor will alert the machine and a safety function will turn off the heater or stop the machine from making any more coffee.
The objective of Functional Safety is to identify potential hazards, analyze associated risks, and implement measures to mitigate or reduce those risks. To properly reduce those risks, Functional Safety experts must thoroughly analyze risk as risk identification, analysis, and reduction are key steps in risk management. This article will explore the process of analyzing risk which is crucial to achieving Functional Safety.
By the end of this article, you will be able to:
- Grasp the role of risk assessment and be able to situate risks within the safety lifecycle
- Understand how a hazard can develop into damage, understand, and correctly use the basic terms associated with risk analysis
- Know how to read and understand a hazard and risk analysis, such as the HAZOP study
- Provide real life examples of risk analysis.
Table of Content
2 Why is the hazard and risk analysis important?
5 Risk assessment in the process industry
1 Safety Lifecycle
While the safety lifecycle is the foundation of achieving Functional Safety in many industries, in this module we will discuss its use in the processing industry. According to IEC 61511, the safety lifecycle consists of eight stages as shown in Figure 1:
- Hazard and risk assessment
- Allocation of safety functions to protection layers
- Safety requirements specification (SRS) for the Safety Instrumented System (SIS)
- Design and engineering of the SIS
- SIS installation, commissioning, and validation
- Operations and maintenance
- Modification
- Decommissioning
Throughout the flow of these stages, Functional Safety professionals will conduct assessments and auditing, planning, and verification. Each stage is designed to ensure that the system or process is designed, tested, and maintained to minimize the risk of accidents and incidents.
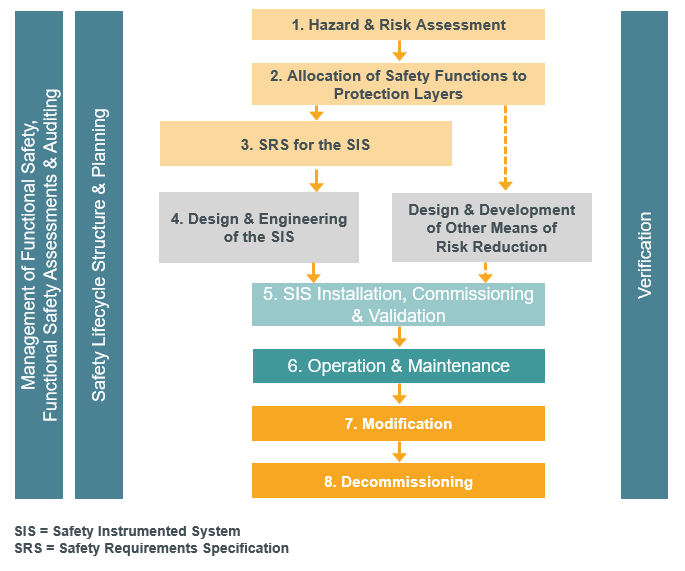
Figure 1: Safety lifecycle based on IEC 61511
Source: HIMA Paul Hildebrandt GmbH
The safety lifecycle sets out the continuous efforts that need to be taken by safety experts to reduce risk. This lifecycle begins with the hazard and risk analysis, which is a crucial part of the process as it is during this phase that Functional Safety experts detect possible deviations from the intended process and assess the various types of risks and potential hazards that a process may pose. The subsequent phases for planning the system are based on this result.
In this artcle, we will explore the hazard and risk analysis, with a focus on the process industry.
2 Why is the hazard and risk analysis important?
All processes deal with a substance - an object or a situation – and these have the potential to cause harm to persons, environment, or equipment. A process can involve hazards due to the substances used or the associated operating parameters such as pressure, temperature, or flow. Controlling the process means that the process parameters are monitored and kept within an approved safe range to ensure safety and avoid hazardous situations. This could be the case in a reactor in which a maximum filling level must not be exceeded because the reaction of two substances can cause foam and block the drain valve. As a matter of fact, this is one of the recommendations of a pressure cooker!
Look at the instruction manual of a conventional pressure cooker and you will find instructions on the maximum level you should fill it, depending on the food you are cooking. Adding more than this recommended level can cause an increased pressure that may lead to an explosion.

Figure 2: Overloaded pressure cooker
Source: HIMA Paul Hildebrandt GmbH
It is only possible to protect against hazards that are known, and this is where the hazard and risk assessment comes into play. Functional Safety experts use the hazard and risk analysis as the basis for defining and controlling the process. Identifying hazards requires a systematic approach to examining the process and detecting possible deviations from normal operation. After the risk assessment, the findings would ideally be integrated into the process design and development phase so that risk is minimized.
There are a variety of methods for hazard and risk analysis. Which method is suitable in a specific case depends mostly on the objective, the scope of the investigation, or the desired result. Some of the most commonly used approaches include the HAZOP analysis (also called HAZOP study), cause-and-effect analysis, checklists, failure mode effect analysis, and fault tree analysis.
The HAZard and OPerability study is the assessment most used in the process industry and this paper will explore this approach in more detail.
Before we further discuss the risk and hazard analysis, let’s go over some relevant terminology. Surely, you have heard of hazards, but do you know the definition used in Functional Safety? Some common definitions of hazard are:
- According to IEC 61508, a potential source of harm.
- According to the American Institute of Chemical Engineers (AIChE), a physical or chemical property that has the potential to cause damage to persons, possessions, or the environment.
- According to the International Electrotechnical Commission (IEC), a potential source of harm.
Many materials, objects, and activities can be a hazard as they can be a potential source of harm. Of course, they do not always result in harm, but their potential to do so is what makes them a hazard. Driving a car is a hazard; cooking on a stove is a hazard; using a medical device is a hazard because a harm could develop out of these activities. Functional Safety experts must start by looking at different types of hazards for the device or process they are analyzing.
If these hazards are not controlled by appropriate safety functions, a hazardous event may occur when people, environment, or equipment are in a specific area and exposed to the hazardous event. This results in a hazardous situation. There is usually a sequence of events that lead up to the hazardous situation where people are exposed to hazards. Harm will occur if these sequences of events occur; harm does not happen for every hazard.
3 Key terms in risk analysis
For a simple illustration of the different terms and the sequence in which a hazard develops into a harmful event, let us take an example from road traffic.
A moving car in the city is a hazard that per se does not have to lead to a harmful event, see Figure 1.

Figure 3: Example of hazard
Source: HIMA Paul Hildebrandt GmbH
However, if the driver does not drive attentively and misses a red light (loss of control or triggering causes), an abnormal situation arises because he drives across the crosswalk in disregard of traffic rules. Suppose that the car is equipped with an emergency braking system with person detection in the city (protective measure), but at this point in time it does not respond due to heavy contamination of the sensor (protection measure(s) failed), a hazardous event arises, see Figure 4.

Figure 4: Example of hazardous event
Source: HIMA Paul Hildebrandt GmbH
If a pedestrian runs across the street at this time (person in the hazard zone), the hazardous event becomes a hazardous situation. In addition, the pedestrian is currently distracted by his cell phone and does not recognize the harmful event, see Figure 5.

Figure 5: Example of hazardous situation
Source: HIMA Paul Hildebrandt GmbH
Thus, the pedestrian is unable to escape the impact. He is hit by the car and injured (harmful event with harm), see Figure 6.

Figure 6: Example of harmful event with harm
Source: HIMA Paul Hildebrandt GmbH
During the hazard and risk assessment, the risk of a damaging event is to be evaluated. The risk depends on the probability that damage will occur and on the extent of the damage. Once the evaluation is complete, protective measures are identified and proposed to reduce the risk. The management team receives these proposals and ultimately decides whether to implement them. If implemented, these can either reduce the probability of occurrence or reduce the extent of damage.
In the example above, a protective measure to reduce the probability of occurrence would be a slight elevation of the roadway in front of the crosswalk to attract the driver's attention. A speed limit, on the other hand, could reduce the extent of damage - if it is observed.
- Hazard: potential source of damage.
- Hazardous incident (or hazardous event): Event that can cause harm.
- Hazardous situation: Circumstance in which people, goods or the environment are exposed to one or more hazards.
- Harm: physical injury or damage to the health of people or damage to property or the environment.
- Harmful event: Dangerous event that caused damage.
- Risk: Combination of the probability of occurrence of a loss and its extent.
| Time to reflect: |
|
Now that you have learned about the difference between a hazard, hazardous event, and hazardous situation, identify two real-life examples of these three definitions. Think about the electronics, devices, systems, and software you use at home, school, work, or in public places. Clearly state what the hazard, hazardous event and hazardous situation are. |
4 Let's define risk
Not to be confused with hazard, IEC defines risk as the probability of the occurrence of harm and the severity of that harm if exposed to a hazard, or if a hazardous event takes place. In other words, risk measures the likelihood that an event will happen and the consequences of that event.
So, in the above example, when pressure cooker is filled with too much food, this could be a potential source of harm to the person cooking the food and the place they are cooking it at. Risk, on the other hand, looks at the chances that the pressure cooker will explode if filled beyond the recommended level, and how bad the harm will be. Will it lead to injury, fatality, destruction of the kitchen or the entire house?
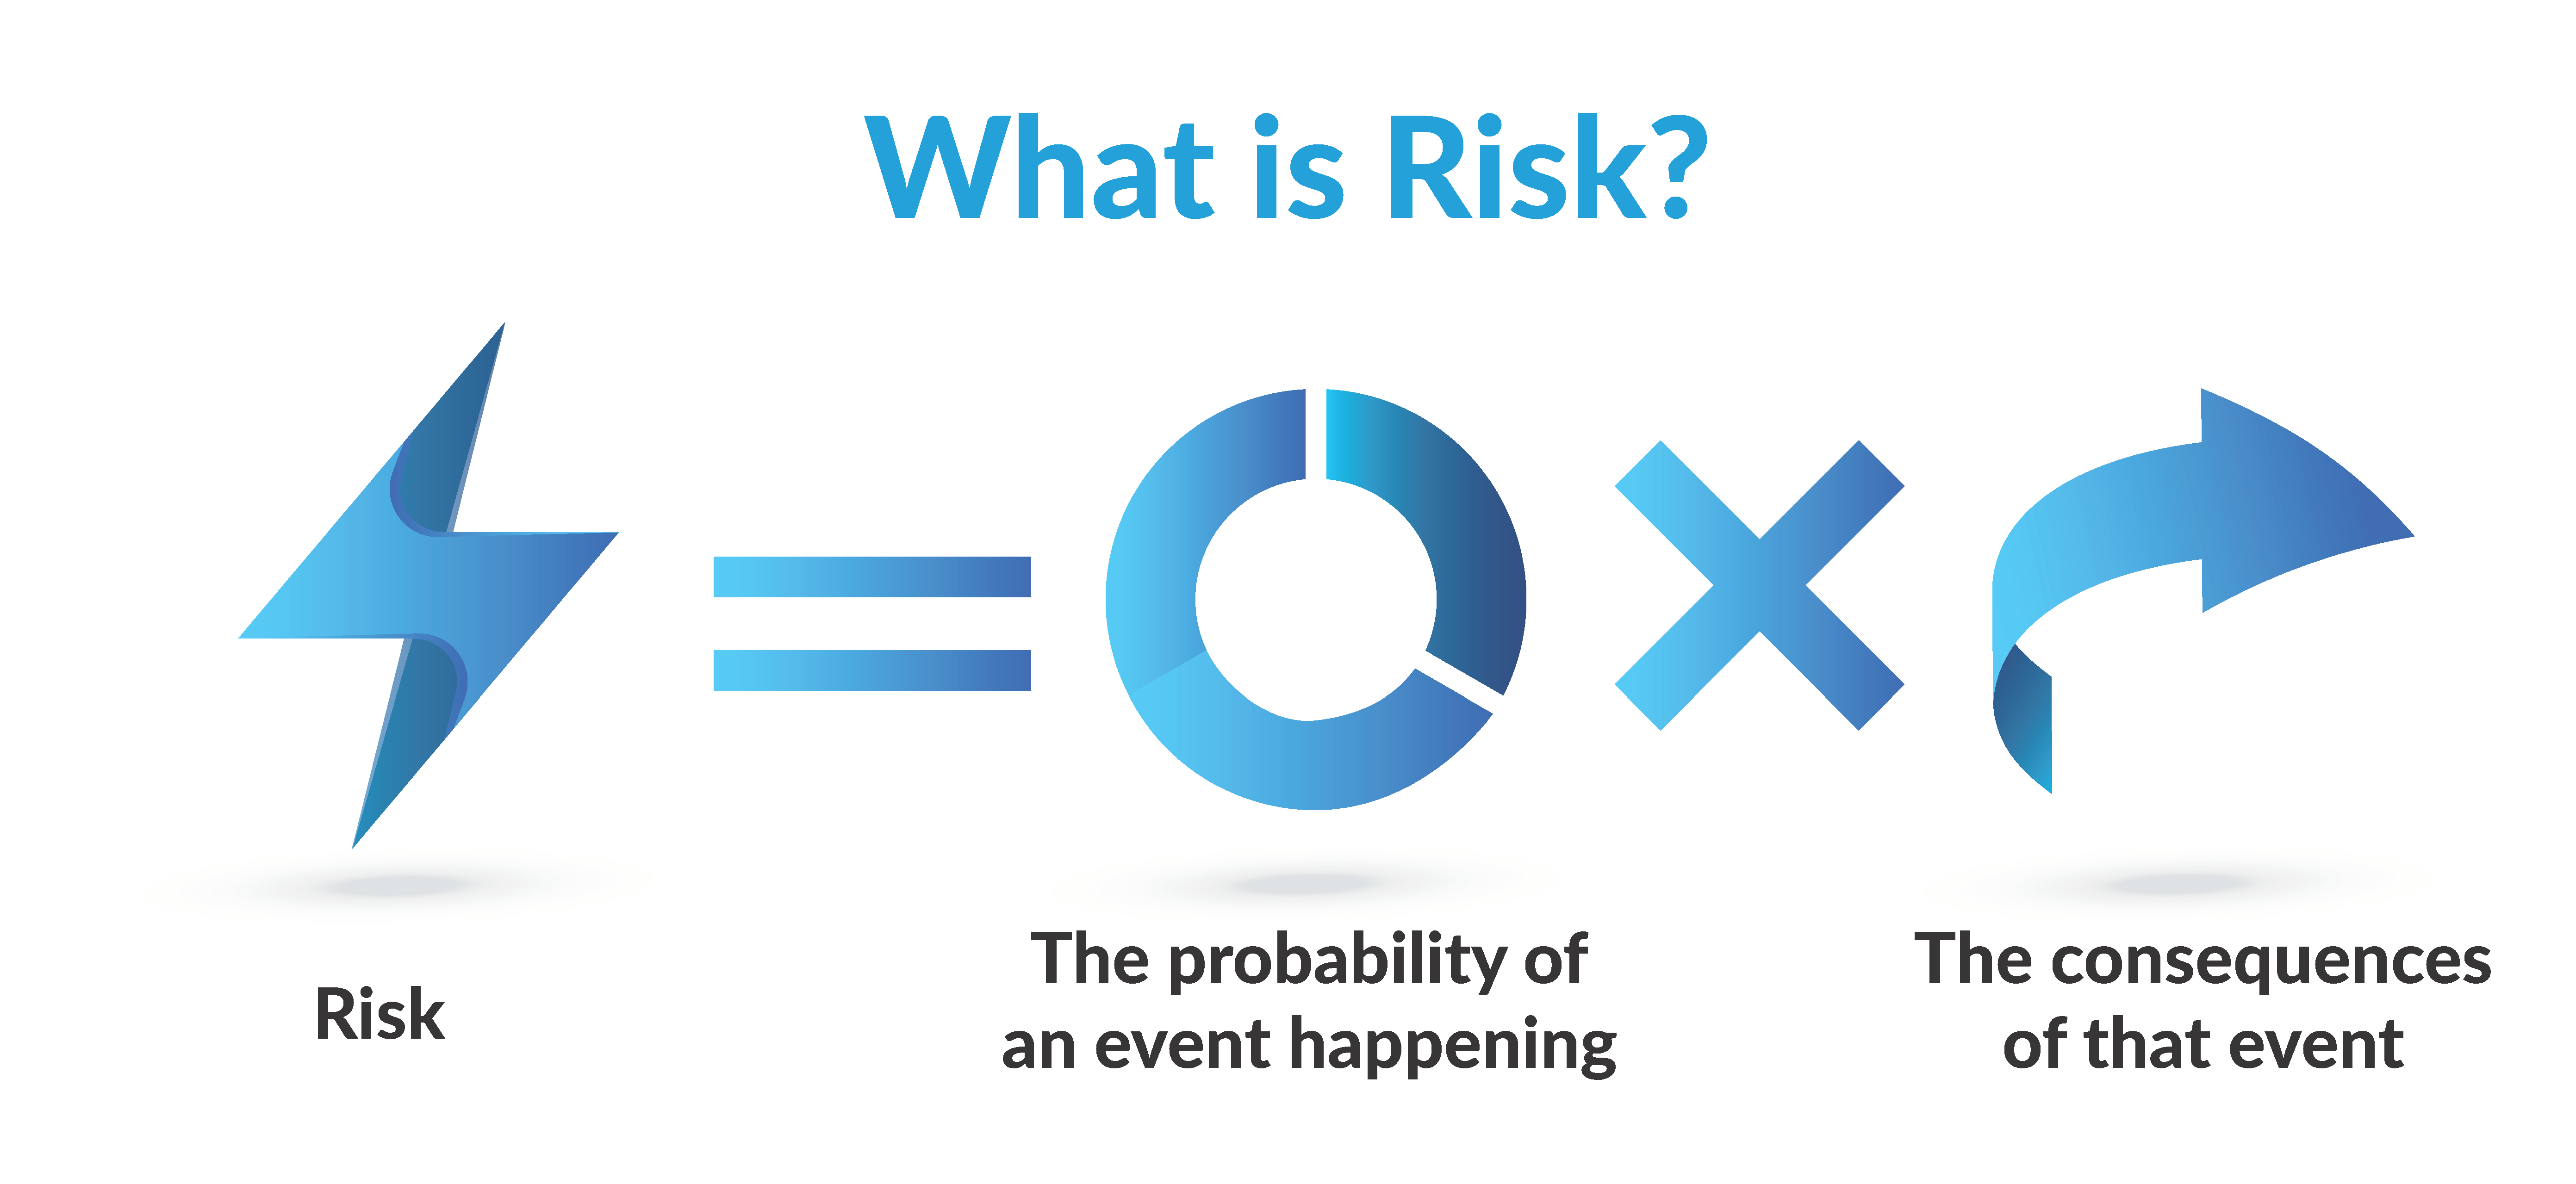
Figure 7: Risk Definition
Source: HIMA Paul Hildebrandt GmbH
Functional Safety aims to reduce risk to an acceptable level. That acceptable level can never be zero as it is impossible to completely remove risk or only after investing an extraordinary effort.
In fact, ISO/IEC Guide 51 defines safety as freedom from unacceptable risk of physical injury or of damage to the health of people, either directly, or indirectly because of damage to property or to the environment.
5 Risk assessment in the process industry
As mentioned above, the hazard and risk assessment is the first and, a very important phase of the safety lifecycle. A preliminary hazard and risk analysis must be carried out during basic planning phases and its results should be incorporated into further planning. During the assessment, hazardous events should be identified and analyzed. The objective is to detect hazards which could occur under all foreseeable circumstances, including past events, to prevent it from occurring again.
IEC 61508 provides guidance on events and circumstances that can lead to hazardous situations. It is a good practice to prepare a master table that clearly shows hazards and statements of sequence of events leading to hazardous situations.
During further planning, additional hazards may be added, and so Functional Safety experts should perform final hazard and risk analysis, which may result in additional protective measures. Also, should the process be modified during the operation of the plant, a hazard and risk analysis should be performed to evaluate the impact. According to Seveso Directive 2013, §9 (5) 1, periodic revalidations should additionally be performed every five years to check the original assumptions against actual operating experience.
Hazard and risk assessment is a team effort in which experts in various disciplines contribute their knowledge - for example, on the process, basic materials (such as toxicity, explosive conditions, and corrosiveness) measurement and control technology, maintenance, and safety regulations (such as laws, standards, and industry guidelines) to identify and analyze all hazards. Normally, the team consists of five to eight people.
Now that you understand what hazards and risks are let’s learn more about how they are assessed to be integrated into the design and development of processes, electronics, hardware, and software. As mentioned in the previous sections, hazard and risk assessment aims to identify and analyze hazards and quantify the risk so that the associated risk can be reduced. This can be achieved qualitatively (explained by words), quantitatively (explained by numbers) or through a mix of both methods called semi-quantitatively.
5.1 Identification of risks
A good risk reduction plan is founded on a thorough risk assessment that identifies all potential hazards as it is not possible to reduce or eliminate a hazard that has not been identified.
5.2 HAZOP
The HAZOP technique is a systematic assessment technique for identifying and addressing potential hazards and risks. This technique would typically be used before a process or plant is designed and developed. A HAZOP study involves the comprehensive review of newly designed or already established complex processes with the aim of identifying potential hazards and deviations from the original design intent.
In some countries HAZOP studies are required by industrial licensing authorities and insurance companies. HAZOP studies can help organizations address potential hazards in operations, past incidents that had the likelihood for catastrophic consequences, human-controlled factors and the consequences of safety functions failing.
5.2.1 Challenges when applying HAZOP
HAZOP is not without challenges and so teams involved in setting up and conducting HAZOP studies should be familiar with the most common reasons a HAZOP may not be successful, to avoid repeating the same mistakes. These most common challenges which may lead to a HAZOP not successfully identifying and helping minimize risks include:
- Team not being creative enough
- Team failing to think about problems and focusing too much on solutions
- Wrong team size or poor team selection
- Poor node selection
5.2.2 Pros of applying HAZOP
The advantages of using HAZOP over other risk assessment tools include:
- the results are high structured, comprehensive and detailed given its systematic approach,
- it is ideal for assessing hazards that are difficult to quantify such as those caused by human error,
- it encourages a broad range of views due to its multidisciplinary team approach,
- it is not highly technical and so allows for non-technical team members to participate, and
- the built-in brainstorming technique can help identify problems early on.
5.2.3 Cons of applying HAZOP
HAZOP does, however, pose some disadvantages including the fact that:
- it is expensive,
- it requires a lot of time and resources,
- it is reliant on agreement from management and only looks at hazards inside the process, software, or hardware.
5.3 Other methods
A HAZOP study is one way of analyzing risk and hazard, however other methods are used as well, including:
- Fault Tree Analysis (Frequency analysis technique)
- Event Tree Analysis (Frequency analysis technique)
- Cause & Effect diagrams
- Dispersion modeling (Consequence analysis technique)
5.4 Conducting a HAZOP study
A HAZOP study is most often conducted by a team of subject matter experts from various disciplines who work together to identify potential deviations from normal operation, hazards, and risks. This team may include those with knowledge of the HAZOP method as well as engineers, chemists, facility managers, safety officers and others. An external consultant or engineer unfamiliar with the process may be included to provide an outside point of view as well.
This team discusses possible deviations, identifying various cases where a system or process could fail. Then they come up with recommendations for improvements and safeguards to lower the risk of identified hazards and operational failures from occurring.
The study will mainly address the plant’s design, physical environment, and procedures. When assessing design, the team will evaluate the design’s capability to fulfill its intended function and identify its weaknesses, for example the composition of a chemical tank. They will also look at the physical environment where the process will take place. That may include assessing, for example, if there is enough space for a chemical batch reactor to operate as intended. Finally, the team assesses the procedure, such as the automation, sequence of steps, and even human interactions.
The HAZOP procedure is used to systematically investigate potential deviations from normal operation among a group of subject matter experts from various disciplines.
The procedure of a HAZOP investigation usually includes the following four phases:
5.4.1 Prognosis of deviations
Systematic generation of possible deviations from normal operation. A deviation is described by combining a so-called guide word and a suitable parameter.
For this purpose, the overall system is broken down into functional units or process sequences and their target functions are described. The following guide words are systematically applied to these target functions:
- Other than/instead
- More
- Less
- Part of
- As well as
- No or not
- Reverse
The corresponding parameters can also be very diverse, here are a few common examples:
- Temperature
- Pressure
- Filling level
5.4.2 Finding the causes
Determining the causes of the respective deviation on the real process.
5.4.3 Evaluation of the consequences
Determine the consequences or implications of the deviations.
5.4.4 Safeguards
Evaluate existing measures and decide on further appropriate safeguards.
5.5 Risk assessment in action
On December 3, 1984, more than 40 tons of methyl isocyanate gas leaked from a pesticide plant in Bhopal, India. 3800 people were directly killed by this leak and thousands more experienced long-term health effects and premature death due to this leak. The plant – run by Union Carbide India Limited – was built on a site that was not zoned for hazardous industry. Still the plant was approved by local government officials to formulate small quantities of pesticides from imported component chemicals. However, with time the company went on to manufacture raw materials to formulate these pesticides. This process was inherently more complex and hazardous.
By 1984, the pesticide plant was only running at a quarter of its production capacity due to decreased demand for pesticides. With decreased profitability, the plant decided to close. While the plant made plans to dismantle its equipment and facility, production continued and at standards well below those found at similar plants in other countries. The government knew of these substandard practices but did not intervene out of fears of job loss and the economic implications.
At 11.00 PM on December 2nd, 1984, an operator at the plant noticed a methyl isocyanate (MIC) gas leak and increasing pressure inside a storage tank. However, the safety device designed to neutralize any toxic discharge – a vet-gas scrubber – had been turned off three weeks earlier. In addition to the turning off that safety measure, a refrigeration unit designed to cool the MIC storage tank had been drained of its coolant so they could use it in another area of the pesticide plant. When a faulty valve allowed water for cleaning internal pipes to mix with forty tons of MIC, pressure and heat from the chemical reaction built up in this tank with no coolant to control the temperature. The gas flare safety system had also been out of service for three months.
This chemical reaction without proper safety functions led to a release of MIC gas into the streets of Bhopal as its million residents slept peacefully. 3800 people died immediately because of the fume – most of them residents of the impoverished slum next to the plant. Authorities estimate the death toll to be as high as 10,000 over the days following the leak.
With local hospitals overwhelmed and with limited knowledge on the health effects of this gas and the proper medical treatment, thousands more experienced poor health and premature death for decades afterwards. Several studied have confirmed a significant increase in morbidity and mortality among the population exposed to this chemical. This disaster could have sadly been avoided by enforcing international Functional Safety standards, including when decommissioning equipment.
Let’s look back at this historical event to see how a HAZOP study could have helped avoid this tragic event. Again, this study will look at the plant’s design, physical environment, and procedures.
As a matter of facts, a chemical production plant is very complex and consists of a huge number of different components. A complete HAZOP analysis for the example of Bhopal would therefore go far beyond the scope. However, the principle can be clearly reduced to the reaction of two chemical components, let us call them A and B, reacting with one another in a boiler. Even with such a simple example: A + B results in C, there are a multitude of potential sources of errors, only some of which are listed in the following table.
Figure 8 illustrates a simple flow diagram of the example without measuring points and controls:
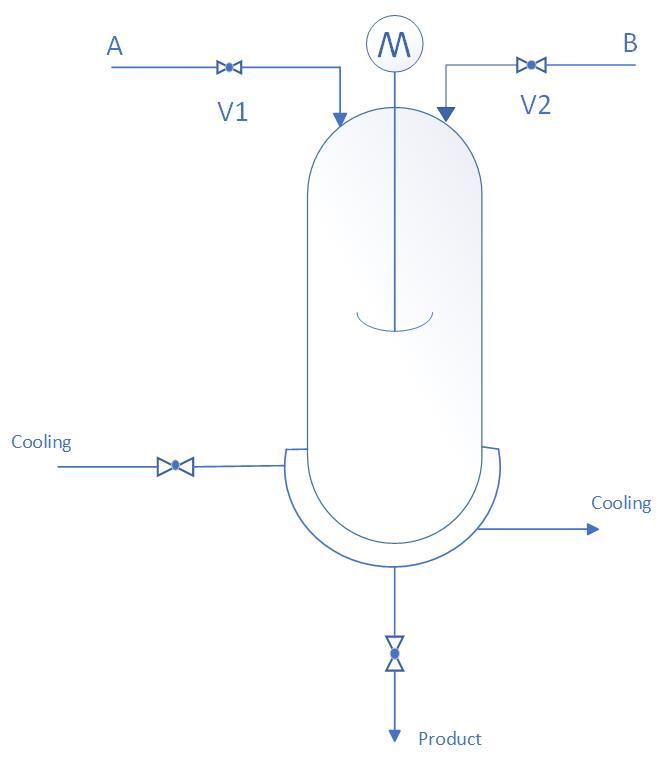
Figure 8: Flow Diagram Illustrating the Example
Source: HIMA Paul Hildebrandt GmbH
In the following table you see an example of how to record the data collected during a HAZOP study. The four steps involved were described in Section 5.4. At the very beginning, the template is filled in with specific data and the target function, see Figure 9 for an example of the stucture template.
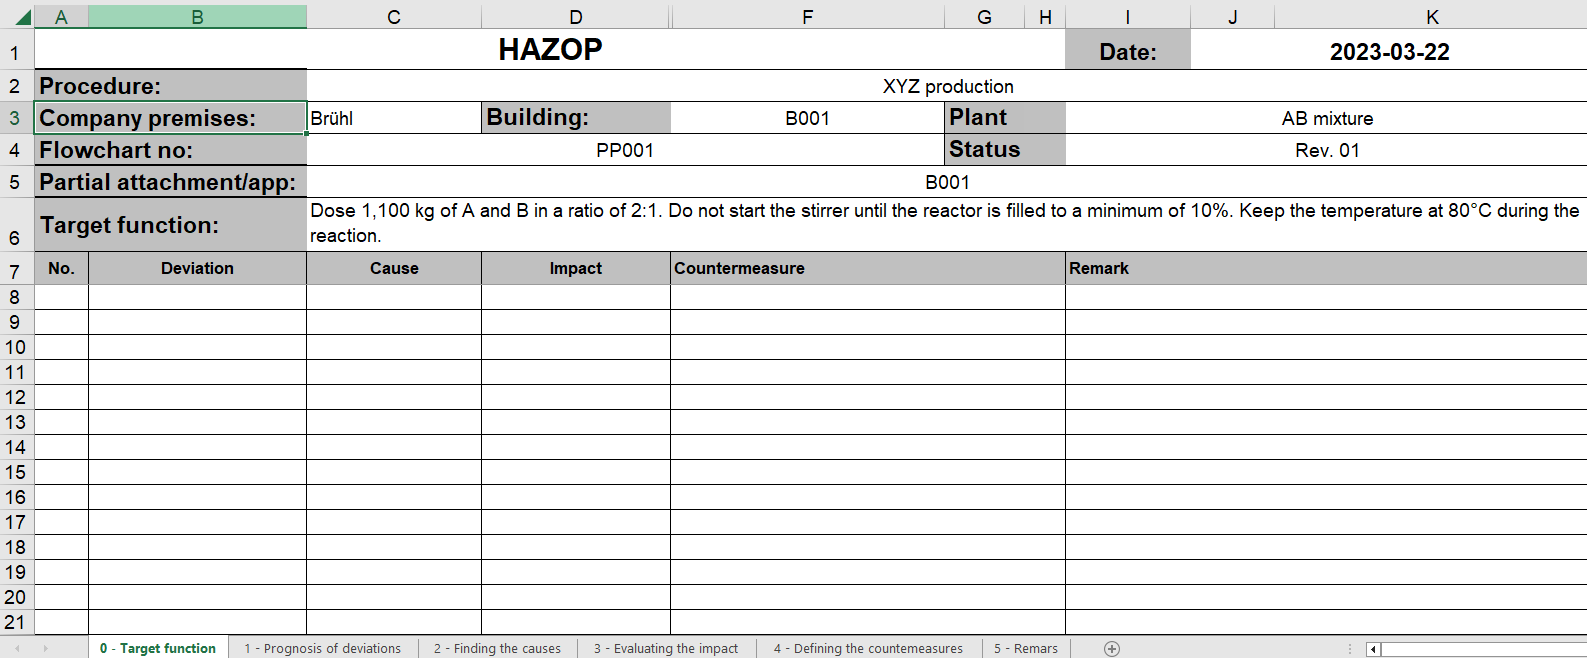
Figure 9: Exemplary HAZOP, Step 0 – Target Function
Source: HIMA Paul Hildebrandt GmbH
Legend: Explanation of the template columns used in the example
| No. | Automatic numbering |
| Deviation | List here deviations from the intended operation. The list of deviations is shown in column A of the "Tables" sheet, and the comments are shown in column B. |
| Cause | Describe here potential causes for the deviation. If possible, create a dedicated line for each cause. |
| Impact | Document here potential effects of the deviation. Make sure that the description of the chain of events is clear, concise and complete making possible an assessment of the incident and its extent. |
| Countermeasure | Describes here the countermeasures that effectively prevent the fault from occurring or limit its effects. Make a distinction between measures that are already in place and those that still have to be implemented, and use different rows for each of them. |
| Remark | Note here any further comment or additional information. |
5.5.1 Step 1
In the first and possibly most important phase, a possible deviation from the normal case is considered line by line and entered in the appropriate column. This step requires a thorough knowledge of the plant, the framework conditions, the technology and the chemicals that are likely to be concerned. A large number of experts must be involved in this phase.
The last example for a deviation refers to the temperature parameter. Note here that the appropriate guide word to use is More, which means that the combination of guide word and parameter does not necessarily follow the conventional use of language.
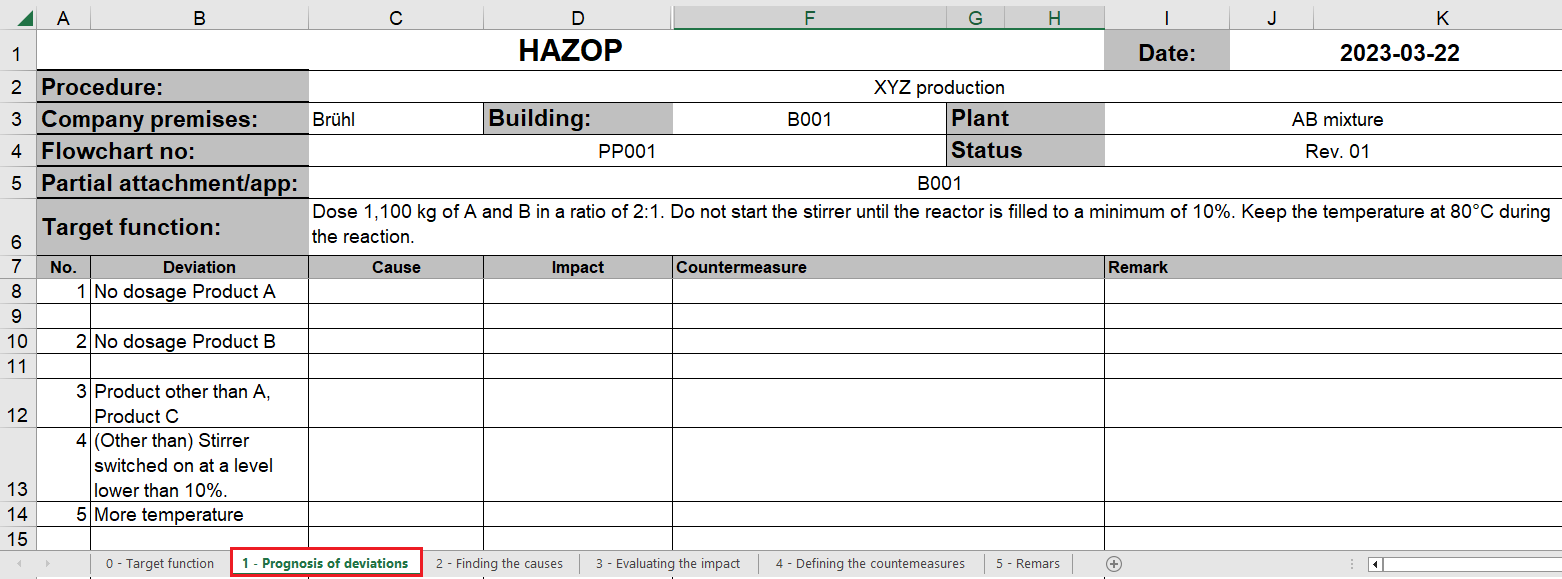
Figure 10: Exemplary HAZOP, Step 1 – Prognosis of Deviations
Source: HIMA Paul Hildebrandt GmbH
5.5.2 Step 2
The identified deviations can originate from a variety of sources, evolve in different ways, and have a range of possible explanations. Therefore, the next step is focused on determining the possible causes for each individual deviation that may occur.
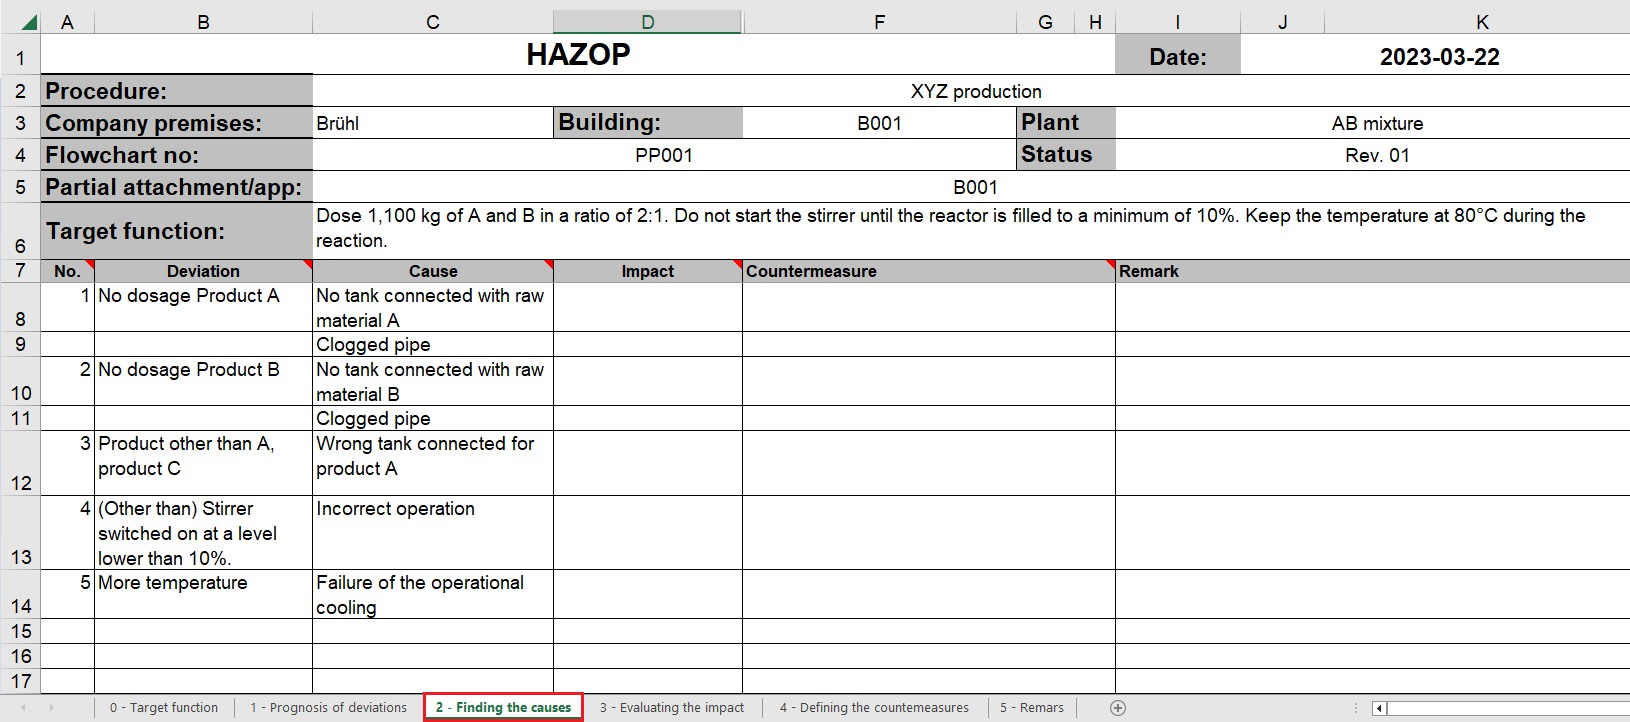
Figure 11: Exemplary HAZOP, Step 2 – Finding the Causes
Source: HIMA Paul Hildebrandt GmbH
5.5.3 Step 3
Note that you only see very few examples in the table. In reality, you need to figure out exactly what might go wrong. For instance, cables that break, valves that jam, the boiler that cracks, sensors that fail, motors that burn out, and so on.
Once all conceivable deviations and causes have been discovered, the next step is to assess their implications.
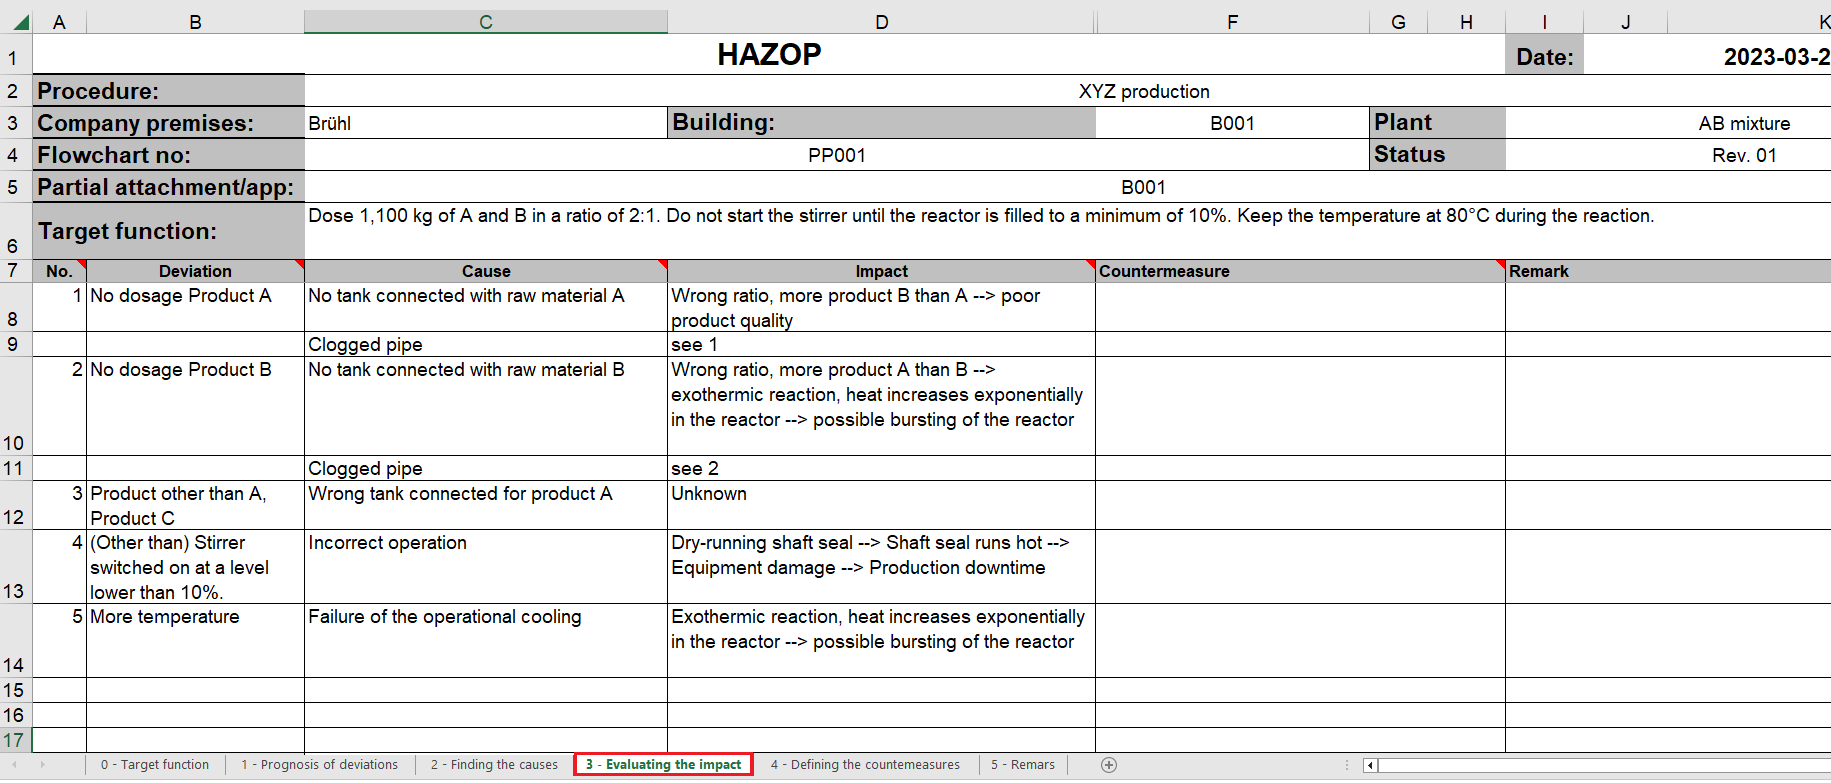
Figure 12: Exemplary HAZOP, Step 3 – Evaluating the impact
Source: HIMA Paul Hildebrandt GmbH
5.5.4 Step 4
You may think that the subsequent step of determining the countermeasures is fairly obvious, but it's not! It can turn out to be a complex task that requires significant effort and may be extremely expensive.
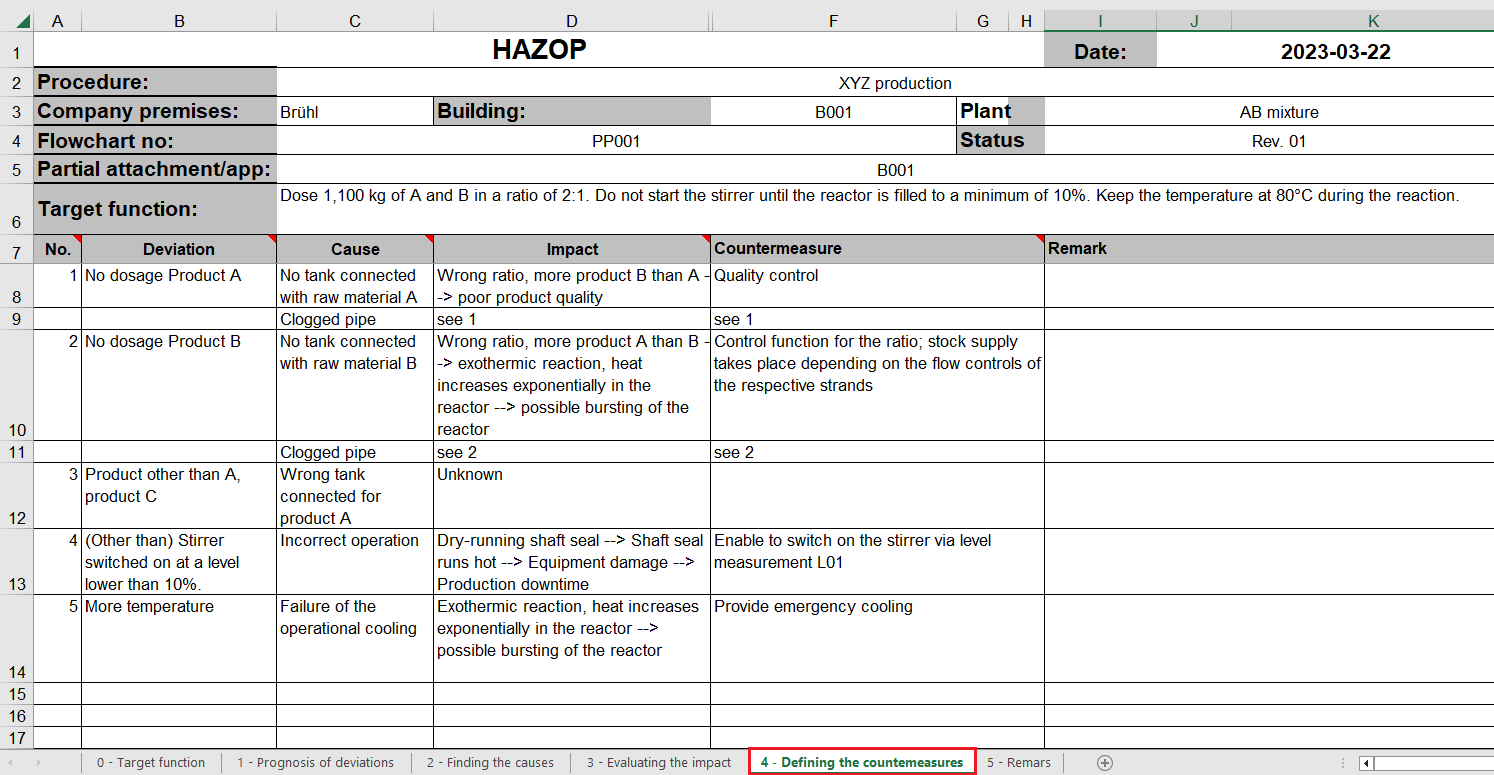
Figure 13: Exemplary HAZOP, Step 4 – Defining the Countermeasures
Source: HIMA Paul Hildebrandt GmbH
5.5.5 Auxiliary step
Comments on each entry can be noted in the table as needed, as a number of other valuable insights emerge from the analysis and related discussions among the various experts.
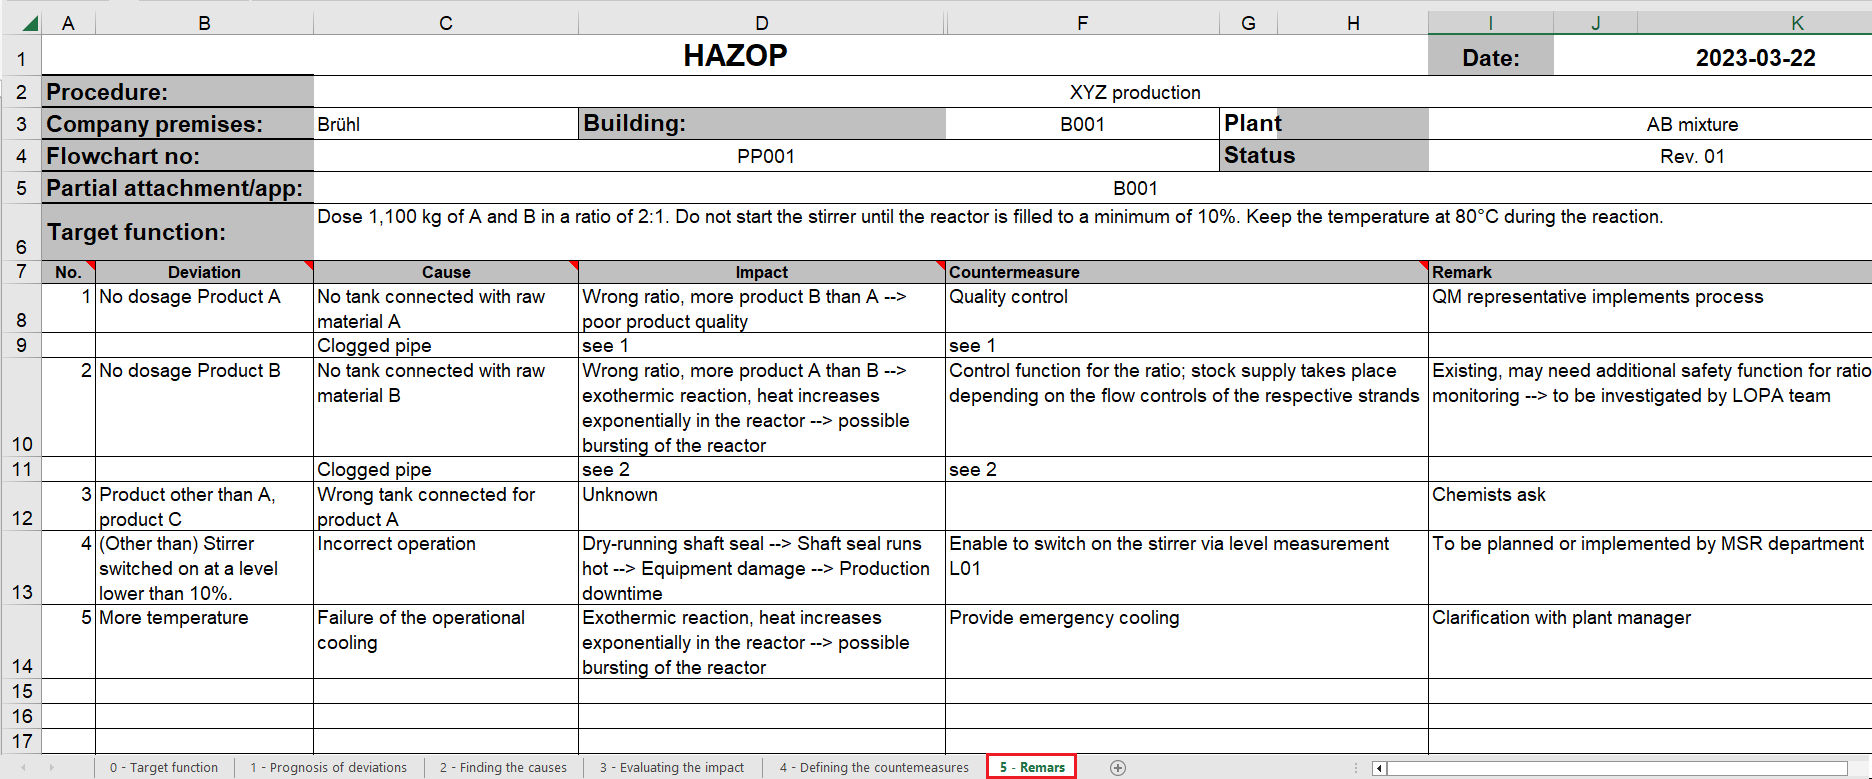
Figure 14: Exemplary HAZOP, Step 5 – Adding Remarks
Source: HIMA Paul Hildebrandt GmbH
This exercise demonstrates how analysis of potential deviations, their impacts, and the safety measures to counter them can reduce risk at a facility like Bhopal.
Had this HAZOP exercise been conducted prior to the gas leak, thousands of lives could have been saved. It was, however, conducted after the incident to help inform other chemical processing factories of potential deviations and create effective safeguards.
| Time to reflect: |
|
Conclusion
In today's world, Functional Safety is an essential aspect of our daily existence. It protects us, our environment and the devices we rely on through carefully designed and implemented systems.
As we've explored in this article , the journey toward Functional Safety depends on a sound risk analysis. This process is indispensable for identifying hazards, understanding associated risks, and, most importantly, implementing effective measures to mitigate those risks. By now, you know how risk analysis contributes to achieving Functional Safety.
Throughout this article , we've delved into the basic terminology and elucidated how hazards can escalate into harmful events. We've also taken an in-depth look at the Hazard and Operability study (HAZOP), a critical tool for risk analysis commonly used in the process industry. Moreover, we've went through the intricate process of conducting a HAZOP study, and shared a practical roadmap for implementation.
With the knowledge gained from this article , you are now better equipped to appreciate the critical role of risk analysis in achieving safety.
Sources
List of references
[1] “IEC 60050 - International Electrotechnical Vocabulary - Welcome,” IEC - International Electrotechnical Commission. https://www.electropedia.org/
[2] Wikipedia contributors, “Bhopal disaster,” Wikipedia, Feb. 08, 2024. https://en.wikipedia.org/wiki/Bhopal_disaster
List of standards
[3] Functional safety - Safety instrumented systems for the process industry sector - Part 1: Framework, definitions, system, hardware and application programming requirements, IEC 61511-1:2016.
[4] Standardization and related activities. General vocabulary, ISO/IEC Guide 2:2004.